
Overview
CamelRatiosIndex implements the multivariate-weighted indexing method for bank performance assessment using the CAMEL framework. The package computes composite year-on-year indices that enable:
- Comparison across multiple banks
- Assessment of bank health relative to a base year
- Evaluation of the overall banking industry health
Based on the methodology proposed by Ayimah et al. (2023a, 2023b). This composite index is intended to offer regulators and policymakers a standardised, objective for monitoring bank performance over time and across institutions. Its ability to benchmark banks against a common base year enhances early-warning capabilities, enabling supervisory authorities to identify emerging weaknesses individual banks as well as systemic vulnerabilities within the industry.
Installation
You can install the released version from CRAN with:
install.packages("CamelRatiosIndex")Or the development version from Github using:
# install.packages("remotes")
remotes::install_github("JC-Ayimah/CamelRatiosIndex")
Quick Start
library(CamelRatiosIndex)

# inspect example datasets
head(camel_2015)   # used as base year's data
head(camel_2022)   # used as current year's data

# Compute CAMEL index
result <- camel_index(camel_2015, camel_2022)

# View results
result$index_table
#> # A tibble: 21 x 3
#>    bank      I_mw    PD
#>    <chr>    <dbl> <dbl>
#>  1 Absa     102.5  2.52
#>  2 AB        98.3 -1.72
#>  3 ADB      101.8  1.78
#>  ...

# Visualize
plot_camel_index(result, highlight_banks = c("Absa", "Ecobank", "GCB"))
Features
- Tidyverse-native: Built on dplyr, ggplot2, and tibble
- Flexible input: Accepts data frames or matrices with bank names
-
Robust statistics: Uses OGK robust covariance estimation via
robustfa - Rich output: Returns index table, weights, eigenvalues, and factor analysis objects
- Publication-ready plots: ggplot2-based visualization with customizable themes
- Built-in data: Example datasets from 21 Ghanaian commercial banks
The CAMEL Framework
| Dimension | Description | Direction |
|---|---|---|
| Capital Adequacy | Ca | Higher = better |
| Asset Quality | Aq | Higher = worse (auto-inverted) |
| Management Efficiency | Me | Higher = worse (auto-inverted) |
| Earnings | Eq | Higher = better |
| Liquidity | Lm | Higher = worse (auto-inverted) |
Functions
| Function | Description |
|---|---|
camel_index() |
Compute composite CAMEL index |
plot_camel_index() |
Plot percentage differences across banks |
print.camel_index() |
Print method for index results |
summary.camel_index() |
Detailed summary of factor analysis |
autoplot.camel_index() |
ggplot2 autoplot method |
Interactive Shiny Dashboard
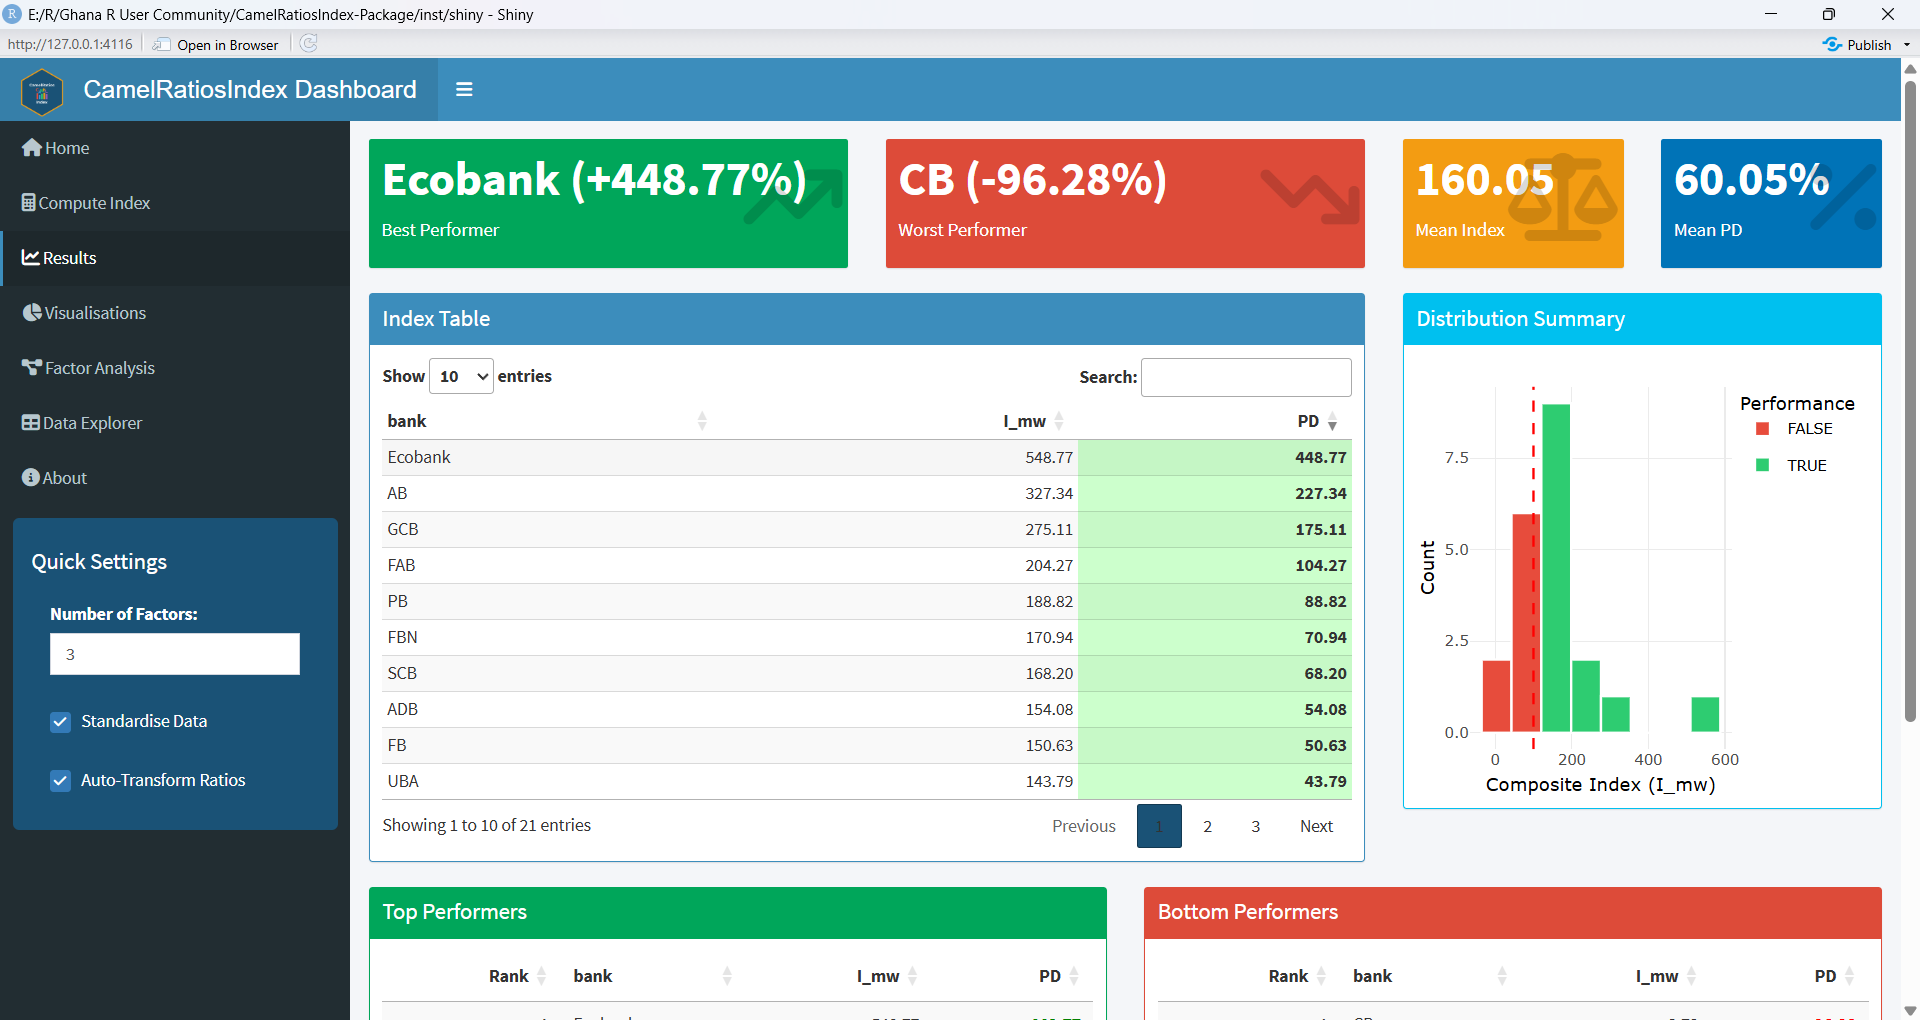
For a graphical interface to the package, launch the included Shiny dashboard NB: The dashboard is currently only available in the development version. It will be made available on CRAN in the next cran release.
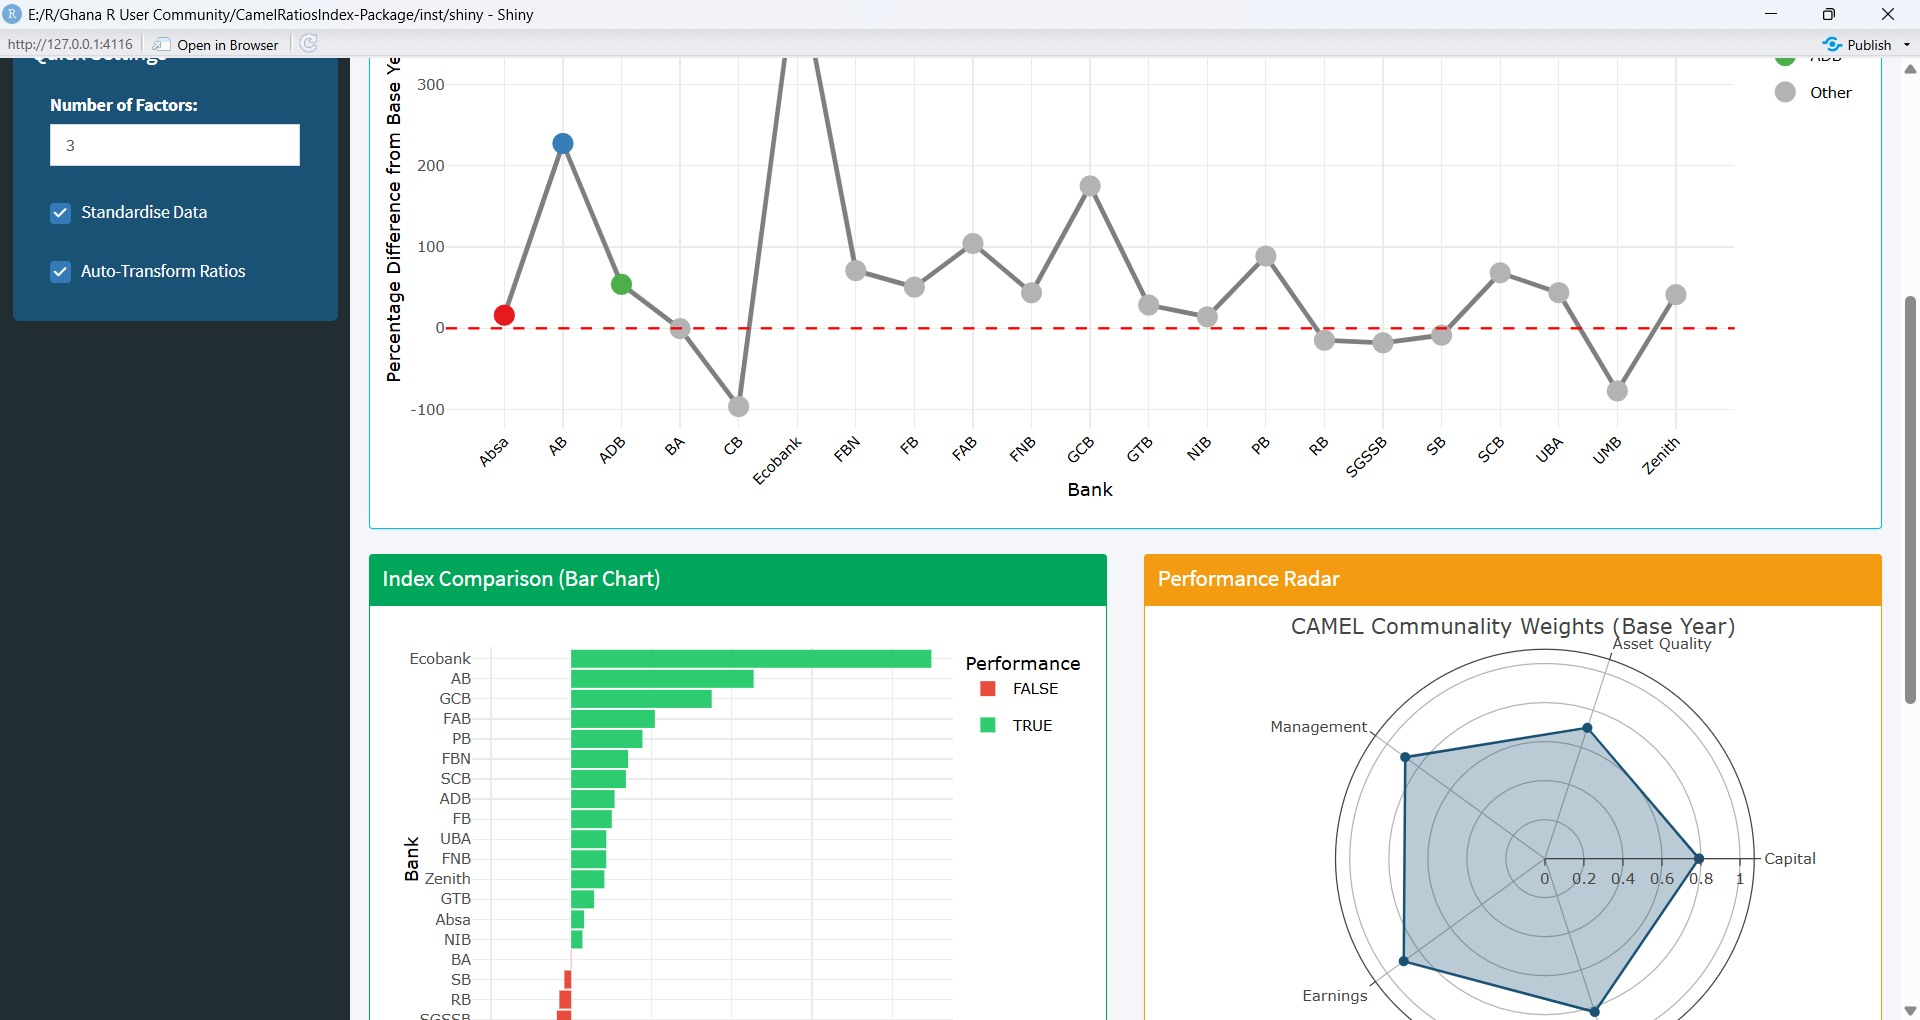
The dashboard provides: - Upload interface for custom CSV data - Real-time computation with adjustable parameters - Rich visualisations: line plots, bar charts, radar charts, histograms, lollipop charts - Interactive tables with colour-coded performance indicators - Downloadable results in CSV, Excel, and RDS formats - Factor analysis explorer with eigenvalues, weights, and loadings
Contributing
Contributions are welcome! Please see CONTRIBUTING.md for guidelines.
References
Ayimah, J. C., et al. (2023a). A Robust Multivariate Weighting Technique for Computing a Measure for Inflation. African Journal of Technical Education and Management, 3(1), 1-15. Retrieved from https://ajtem.com/index.php/ajtem/article/view/53.
Ayimah, J.C. (2023b). Computing Multivariate-Weighted Consumer Price Index: An Application Manual in R. B P International. DOI:http://dx.doi.org/10.9734/bpi/mono/978-81-19315-32-1